The Story of the Citizens' Map

Every line on a map, every twist or turn, is there for a reason. Sometimes those are good reasons--keeping communities intact. Sometimes they’re not--when they let politicians choose their own voters to protect their own jobs. Collectively, the lines tell a story of the whole map. If the leaders of the General Assembly want people to trust their judgement, it’s critical that they share the story with their constituents. Here is the story of the Pennsylvania Citizens' Map.
The Pennsylvania Citizens’ Map is a composite map of 17 congressional districts in Pennsylvania that attempts to represent what over 7,200 Pennsylvanians, from 40 of the 67 counties and representing 90% of the Commonwealth’s population, have collectively mapped in five Draw the Lines public competitions held since 2018. The contests were open to anyone in Pennsylvania, and 1,500 citizen mappers completed the challenge. They range from 13 year-old high school freshmen, to college students from institutions across PA, to senior citizens.
Each of these 1,500 maps was drawn and scored on common mapping metrics using free online software (DistrictBuilder and Dave’s Redistricting). The statistical averages became benchmarks by which to draw the Citizens’ Map, as did the values that mappers declared important to them.
With the benefit of their energetic and skilled involvement and insights, Draw the Lines published the original version of the Citizens’ Map in September 2021. After the map was released, citizens were encouraged to make comments on the DTL website on what they liked and didn’t like about the map. After taking those recommendations under advisement, Draw the Lines has now produced a second, final version of the map.
So the Citizens’ Map, in effect, represents the everyday Pennsylvania mapper and voter. Further, by using hands-on public involvement to draw the original map, then publishing the map and asking for feedback, and then revising it, Draw the Lines has modeled a transparent and accountable public process. The Citizens’ Map is not a perfect map. But it represents what our thousands of mappers and a clear majority of public commenters would want to see in their congressional maps.
Among those criteria selected are those contained in the landmark 2018 Pennsylvania Supreme Court decision overturning PA’s 2011 congressional maps. Accordingly, it uses the current map that resulted from that case as a general starting place.
Going from 18 districts to 17
Removing a district has ripple effects across the state. As written elsewhere, the 2020 Census data shows that Pennsylvania’s population has largely shifted south and east, impacting districts 1-7, 10, and 11. Conversely, seven current districts lost population relative to the 2010 Census, and will thus expand or shift geographically to meet the target population. These were located in the Northern Tier, central PA, and much of western PA.
In the Citizens’ Map, the districts that changed most significantly were the old Districts 12 and 15, focused on the northern tier and central PA. District 9, which bordered District 12 plus the growing districts in the southeast, saw significant change as well.
How does this map stack up to the 2011 map?
This map is far superior to the plan drawn in 2011 by the General Assembly, which was done in secret, without any public vetting or comment. It splits half half as many counties (14 to 28), is more than twice as compact (37% Polsby Popper, versus 16%), with six solidly competitive seats and fair representation (versus an average of one). It contains two majority-minority districts and has strong regional cohesion. Draw the Lines is confident that this map should be considered by whatever body is drawing PA's final congressional map, be it the General Assembly or the courts.
Achieving a zero population deviation with compact districts that make regional sense and minimize splits, while being politically fair, requires a number of tradeoffs and less-than-ideal solutions. But we challenge the General Assembly to come up with districts that meet as many of the goals as this map does, and with as much public input.
The Metrics
Equal population: It is standard practice that congressional districts have the exact same number of people, down to the person, to avoid court challenges on the basis of “one person, one vote.” This map has a total deviation of 1 person (764,864 to 764,865).
Draw the Lines would argue that requiring every district to have the exact same number of people in them sets a standard for false precision. People are born, die, and move every day. It’s unfortunate that this requirement exists often at the expense of other values, like limiting political subdivision splits or maximizing compact districts. Most troublesome, the Citizens’ Map demonstrates that to get to zero population deviation, a map must split numerous precincts (22), which creates serious election administration concerns at the polling place on Election Day.
We would encourage the General Assembly to pass a statute allowing for up to a 0.75% population deviation in a congressional map.
Contiguous and compact: Two values that mattered significantly to DTL mappers were contiguous and compact districts, two values cited by the State Supreme Court as necessary and codified in the PA Constitution for state legislative districts. Each district is contiguous in the Citizens’ Map. Further, it achieves a 37% Polsby-Popper (PP) compactness score. The median PP score of the 1,500+ congressional maps produced by DTLers was 33%. This map significantly improves upon the 16% mark from the discarded 2011 maps. It also exceeds the 33% PP mark of the 2018 map. (If you use a different compactness measurement, Reock, this map is roughly equal to the 2018 map - 44% to 43%, respectively. Read more about the differences between the Polsby-Popper and Reock measurements.)
Jurisdictional splits: While limiting jurisdictional splits was not a top-3 priority for our mappers, it was cited by the State Supreme court in 2018 as necessary. Minimizing splits has a number of benefits: ease of election administration for county officials, limiting confusion among residents of who their elected officials are, and enabling communities to vote with a unified voice. This map splits 14 counties a total of 16 times, a slight improvement on the 14/18 split by the 2018 map and far superior to the 28 counties split 38 time in the 2011 map. It also takes pains to minimize splitting municipalities (16 total). Most municipal splits are unavoidable due to size (like Philadelphia), or due to the zero population deviation requirement. A few splits (like Pittsburgh) were the result of trade-offs to maximize other values (like communities of interest, compactness, and political competitiveness).
Compliance with the Voting Rights Act: To adhere to the Voting Rights Act, Districts 2 and 3 are majority-minority districts. District 2 is a coalition district (29% Black, 22% Hispanic, 10% Asian), while District 3 is majority Black (55%). A few DTL mappers created a third majority-minority district, and others aimed to achieve a 37% single-minority population in additional districts; this figure has been cited as a baseline for giving a racial minority a chance to elect the candidate of their choice while maximizing their voting power in other districts. However, doing so on the Citizens’ Map would have had ripple effects on compactness, splits, and regionality.
Competitiveness: Throughout the Draw the Lines competitions, Pennsylvanians stated that they valued districts that created competitive elections. The Citizens' Map, using 2016-2020 composite election data, would yield five strongly Democratic and six strongly Republican districts. Five districts would produce competitive elections (major party candidates within 10% of each other). This exceeds the median that DTL mappers were able to produce (four competitive districts), plus the four elections that would be classified as competitive under this standard in 2018 and 2020. The 2011 map was notoriously uncompetitive—only three races total between 2012-2016 finished with candidates within 10% of each other.
Partisan fairness: Our mappers were almost unanimous in placing partisan advantage last when ranking the values that define a map. Accordingly, this map rates well on “proportionality,” meaning that if either party were to win 50% of the statewide vote, they would win 8-9 seats if the map were perfectly proportional.
PlanScore, which evaluates maps for partisan fairness, gives two readings on the efficiency gap metric. When not factoring in the status of incumbents, PlanScore gives the Citizens’ Map an efficiency gap of 3.5% in favor of Republicans. This means Republicans would win an extra 3.5% of 17 seats, or an extra half-seat. When factoring incumbency, there is a 0.2% gap in favor of Republicans. For reference, the overturned 2011 map was +19% R (worth about 3 extra seats) and the 2018 remedial map was +2% R.
Incumbency: While the locations of incumbent members of Congress was a value roundly rejected by DTL mappers, the Citizens’ Map does partially consider these locations. This map attempts to balance the value of "wiping the slate clean" with the value that dramatically altering the previous map and moving congresspersons around to new districts can be disruptive to representation.
The chart below compares the Citizens' Map to the 2011 and 2018 maps, plus the recent map that passed the House on January 12, 2022.
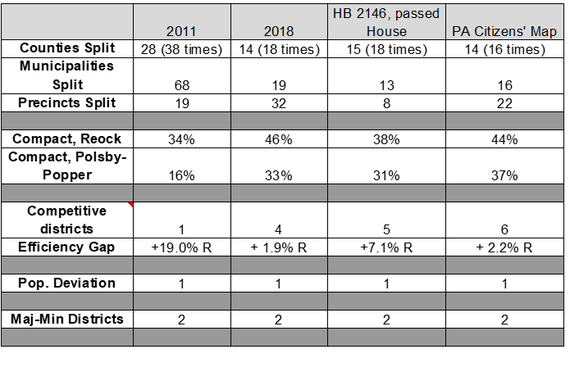
* A note on data: The Citizens' Map includes data adjusted for finalized 2021 precinct boundaries from the Legislative Data Processing Center. It does not include the dataset that the Legislative Reapportionment Commission is using for the state legislative maps that reallocates prisoners back to their last-known home address before incarceration.
District-by-District Descriptions
The value of “communities of interest” was important to DTL mappers as well. Any redistricting process that faithfully attempts to receive and incorporate public feedback is essentially seeking clarification from residents about important aspects of their communities that otherwise may not be known or apparent to map makers. This map attempts to demonstrate the most frequent regions of interest or other considerations important to Pennsylvanians (e.g., geographic features) that our mappers have represented over the last three years.
District 1: Bucks County has been held together within a single district since the 1930s, and the majority of DTL maps did the same. The Citizens’ Map does as well. To meet the population requirement, it dips into northeastern Philadelphia, as the character and culture of southern Bucks is quite similar to Wards 58, 65, and 66 in Philly.
District 2: CD2 is made up of the rest of Northeast Philadelphia, over to Broad Street, and then down to the Pennsport neighborhood in South Philly. DTL mappers frequently used Broad Street as a clean dividing line, and this largely mirrors the 2018 map. The Citizens’ Map takes care not to split Temple University, incorporating Wards 32 and 47. This trade-off ensures the second largest university in the Commonwealth is held together. It also includes Cheltenham and a part of Abington Township in Montgomery County. CD2 is a minority coalition district, with the voting-age population being 61% BIPOC.
District 3: CD3 contains Northwest, West, and much of South Philadelphia. CD3 is a majority-minority district, with Black voting-age residents making up 55% of the population.
District 4: This district centers on the majority of Montgomery County. The region’s population growth, particularly in Montgomery County, meant that behind Philadelphia, it was the most logical district to maintain a second split. Thus, the Pottstown and Pottsgrove area in the northwest (to CD6) and Cheltenham/part of Abington (CD2) are the only Montgomery County municipalities not included in CD4.
District 5: CD5 contains all of Delaware County and the southern part of Chester County. DTL mappers were divided on pairing Delaware County with Chester or with south Philly by the airport (as was done in the 2018 map). Due to trade-offs elsewhere in the map (mainly by including Berks with Chester County), the Citizens’ Map now pairs two of the faster growing counties in PA.
District 6: Northern Chester County and the majority of Berks County (including Reading) are joined together in CD6. After being split among four districts in the 2011 map and three in the 2018 map, Berks County is only split once in the Citizens’ Map. DTL mappers frequently matched Berks with Chester in their maps. An additional round of public comments spurred DTL to include South Coatesville with Coatesville in CD6.
District 7: CD7 couples Lehigh and Northampton County, which together comprise the Lehigh Valley. This was one of the most common groupings of any two counties in DTL maps. CD7 includes Carbon County and a part of Monroe, which mirrors those communities’ connections via the Northeast Extension (I-476). DTL fielded public comments about including the Stroudsburg area with CD7, but there was not a clear consensus. It is included in CD8.
District 8: CD8 is anchored by Scranton/Wilkes-Barre, which DTL mappers from this area often took pains to keep together, along with Hazleton. DTL heard from residents that combining Lackawanna and Luzerne Counties with Pike and Monroe Counties brings together two clear communities (the SWB metro area and the Pocono commuter rim). It also includes Wayne County.
District 9: CD9 groups northern tier counties with some of their more southern counterparts that share cultural characteristics. It keeps the Susquehanna Valley together, a recognized region with counties containing common cultural and economic interests (Columbia, Union, Snyder, Montour, Northumberland). It also comes close to the municipal limits of the Wilkes-Barre area. The current 9th District is one of the districts most likely to change as population shifts away from the northern and central parts of the state, towards south central and southeast.
District 10: CD10 is all of Dauphin and the western half of York County, including the city of York. There was no clear consensus among our mappers if York County should be attached to Lancaster County to the east or Adams County to the west. CD10 in the original Citizens’ Map included Adams, York, and parts of Cumberland County. However, this created an awkward connection between half of Dauphin County (including Harrisburg) and some of the south-central counties with which it had little in common, like Bedford and Blair County. It was universally panned by Dauphin County residents, inspiring the revision.
District 11: The Lancaster County Commissioners recently approved a resolution expressing the desire for the county to be held together during this process. The Citizens’ Map respects that request. It also includes Lebanon County and the eastern half of York County.
District 12: CD12 is another northern tier district, made up of much of the Pennsylvania Wilds. DTL hears frequently from Centre County and its Democratic-leaning electorate that they are tired of continually being grouped with more red counties surrounding it on all sides. However, this map is not able to address those concerns, as minimizing splits and creating a compact district became more relevant. Much of this district used to be 15th in the old map, which lost the most raw population from the last round of redistricting.
District 13: Broadly, this district is a grouping DTL saw from mappers who were very focused on geographic features in south central PA along mountain ranges and watersheds. It aims to keep together communities within the Allegheny Mountains and valleys region. In the original Citizens’ Map, CD13 contained Harrisburg, but that created a widely disliked community-of-interest split in the Capital Region between CD10, 11, and 13. The new CD13 includes Adams County and most of Cumberland.
District 14: CD14 combines the Laurel Highlands (Westmoreland, Fayette, Somerset), with Washington and Greene Counties in SW PA, that have similar history, interests, and culture. This was referenced by numerous citizens at a House State Government Committee hearing on this topic in Uniontown in August. DTL mappers were generally more likely to include Somerset in a district with Bedford County and others to its east; however, due to population decline, to maintain a solid Southwestern PA district, CD14 in the Citizens’ Map includes Somerset. CD14 also includes Johnstown in Cambria County to meet the population requirement.
District 15: CD15 is composed of the eastern half of Allegheny County and extends into Westmoreland County. Pittsburgh is the anchor of this district. This district splits Pittsburgh, using the confluence of the three rivers and the Fort Pitt Bridge as a natural western boundary. It crosses over the Allegheny River to include much of the North Hills, like O’Hara and Fox Chapel. We heard from several public commenters that splitting Pittsburgh is not ideal. However, many of our mappers, including those in the area, used natural boundaries in the city to divide their districts, particularly at Point State Park where the Three Rivers come together. That's where the Citizens' Map divides District 15 and 17.
District 16: CD16 is anchored by Erie County, and then uses the I-79 corridor to connect Erie to counties south of it, down to Butler County. CD16 fairly closely resembles the current map. While unfortunate that this district splits Butler County, this was a trade-off for equal population purposes.
District 17: CD17 combines Beaver County with the western half of Allegheny County. A large number of mappers used the western part of Pittsburgh to give this district enough population, so as to limit splitting Washington County to the south (CD14) or Lawrence County (CD16) to the north. This district will also be one of the more heavily watched districts with regard to the 2022 election, with incumbent Conor Lamb running for Senate and creating a very close toss-up district.
We want to hear from you!
What do you think of the map? Leave us your feedback, and what you would like the see the General Assembly do differently.