Personal Statement
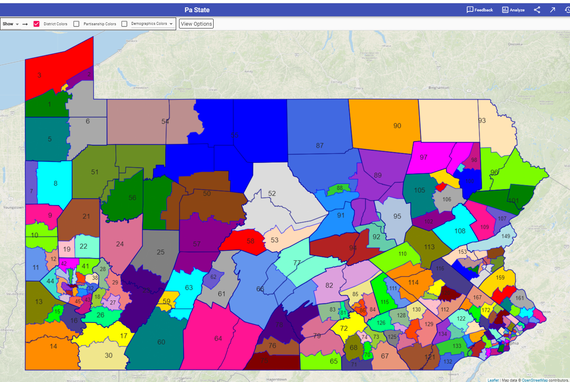
Presented here is the a drawing of the Pennsylvania legislative districts (203 in total) based on 2016 voting data. I chose to prioritize competitiveness, compactness, and equal population in the map. The reason is: (1) voters would be more likely to turnout on Election day if the district is competitive, (2) voters prefer nice, tidy districts versus outstretched, contorted districts, and (3) each constituency should have an equal voice in the General Assembly. In the map, the best example of competitiveness is when districts were drawn near the boundary between inner city and rural areas. For areas that were +20 Democrat or +20 Republican, I tried to draw compact districts as a visually appealing approach to redistricting. Lastly, I aimed to maintain equal population in the districts within 10%.